Research findings
Public NHL goal replays let us estimate which offensive teammates qualify for screen assists and compare those credits with independent Clear Sight Analytics (CSA) annotations. We assess both whether a goal involves an offensive screen and whether the detector identifies the annotated participants, then use the selected detector to produce player counts and playing-time rates. A separate CSA shot analysis includes goals and non-goals to examine the association between offensive screening and scoring after adjustment for observed shot context. Together, the analyses address attribution on scored goals and scoring probabilities within the observed shot population.
Player rankings
The player rankings span 2023–24 through 2025–26 and completed 2026–27 games through October 19, 2026. Within this coverage, — of — non-shootout goals remain evaluable after empty-net and tracking exclusions. The leading totals for the most recent completed regular season appear below, while the rankings table also offers playing-time rates and adjustable exposure filters. Selecting a player opens their credited-goal list for replay inspection, including plays that qualify only under the broader definition.
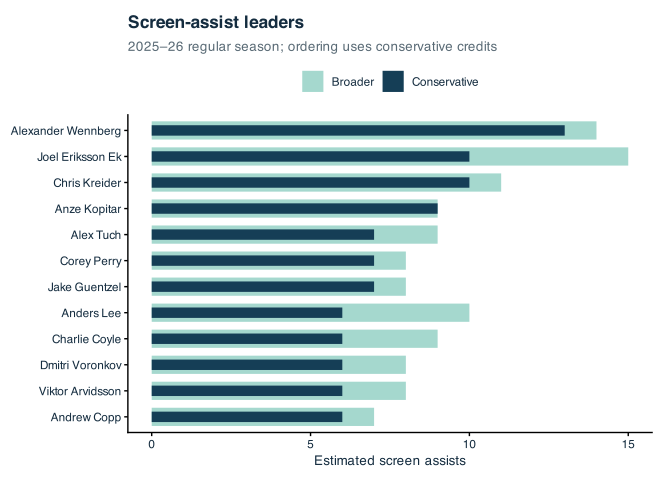
Screen detection and player attribution
Evaluation separates three seasons: we develop the detector on 2023–24, select its model and thresholds on 2024–25, and freeze those choices before testing the reserved 2025–26 season. Goal detection and player attribution are assessed separately because a screened goal can be identified correctly while credit goes to the wrong teammate. For player attribution, precision is the proportion of predicted credits that agree with the reference, and recall is the proportion of annotated contributions recovered. The goal-level measures apply the same comparison to screened goals.
| Definition | Task | Precision | Recall | Reference units |
|---|
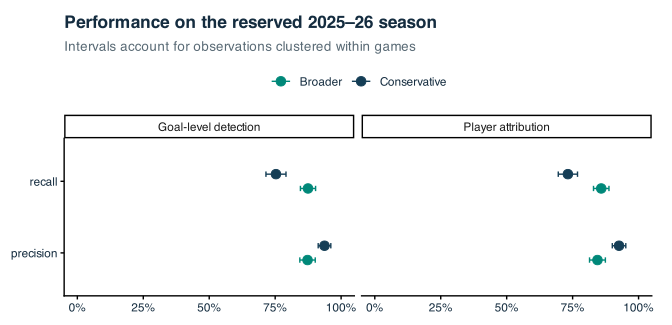
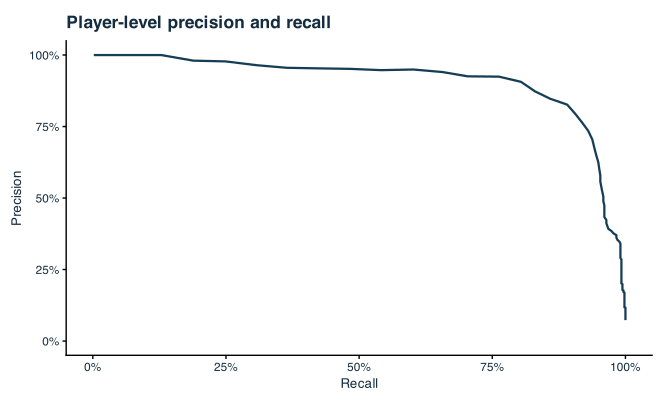
Player-level average precision is —, with the conservative threshold favoring precision and the broader threshold recovering more annotated participants. This benchmark contains explicit screen and non-screen classifications that pass matching and replay-quality requirements, which makes it a selected reference population. Missing participant records alone never establish a negative event label; within events with recorded participants, attribution evaluation assumes the list is complete. Individual rankings inherit both these reference limitations and the detector’s measured errors, while the underlying planar tracks leave the goaltender’s three-dimensional view unobserved.
Precision–recall curve and calibration
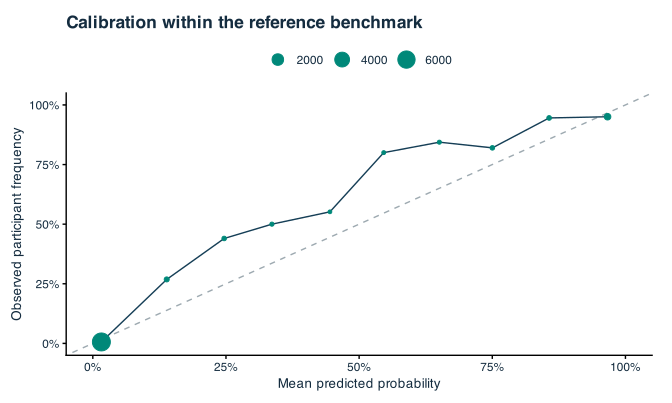
The Brier score of — summarizes prediction error across the selected CSA reference population. Its low value partly reflects the large lowest-score bin; intermediate-score bins have higher observed participant frequencies than their mean predicted probabilities. Calibration outside this reference population remains unknown. The aggregate evaluation also reports sensitivity to alternative positional and timing assumptions.
Screening and scoring probability
The scoring analysis follows a separate population of reviewed CSA shots from 2024–25 and 2025–26, including both goals and non-goals. Offensive-screen and clear-sight shots enter the comparison only within season, strength, precise-location and release-type strata containing both groups. This shared set of shot contexts contains —. We standardize both predicted scoring rates to the observed characteristics of the screened shots so that the comparison uses a common covariate distribution.
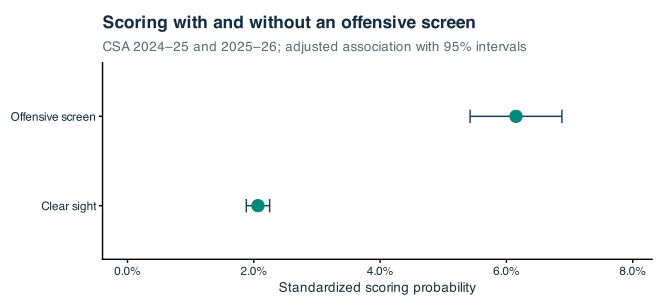
The adjusted odds ratio is —. Adjustment uses a mixed-effects logistic model with season, competition, strength, shot location, release type, broad play context, preceding pass locations and both teams, plus shooter, goalie and game random intercepts. The comparison excludes screen-on-pass cases, posts, deflection releases, and the separate mixed-screen, defensive-screen, one-timer/screen and rebound classifications. These eligibility rules define the observed population, which does not cover all NHL shot attempts; unmeasured shot characteristics and annotation choices may still contribute to the association.
A fitted goalie random-intercept variance of zero places that component at its boundary. We retain this estimate and hold all variance components at their fitted values when calculating the model-based intervals. The intervals account for fixed-effect uncertainty conditional on those values, leaving other sources of model and annotation uncertainty outside their scope.
Related research and interpretation
Justin Cait’s manual screen-assist work records stationary and moving screens on goals, providing a goal-based approach to attributing screening contributions. Other studies describe related aspects of the play: tracking-based traffic research examines players between the puck and goalposts, while net-visibility research combines tracking with player poses. Our analysis uses public goal-replay tracking to estimate player-level credits and assess their agreement with independent annotations, with each credited play available for inspection.
Screening on saved, missed or blocked attempts lies outside the goal-replay rankings, and detector performance on those plays remains untested. The separate CSA model adds evidence about scoring within its observed shot population, whose composition and estimand differ from those of the detector. Multiplying the adjusted association by a player’s screen-assist total does not estimate causal goals added. Such an estimate would require a broader account of shot selection and screening opportunities, together with a defensible comparison of the outcomes expected with and without the screen.